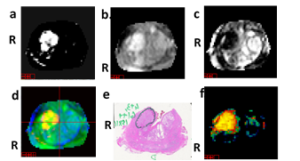
The hypercube is displayed in color by assigning the spatially registered red (r) to washout of kep, green (g) to DWI-Hi B, blue (b) to ADC. The high tumor vascularity will result in elevated kep or washout (red), reduced proton diffusion from higher cellular density or elevated DWI-High-B (green) but lower ADC (blue). Recall that the high magnetic field gradient (high B value) means low diffusing protons are elevated relative to faster diffusing protons. The combination of high red and high green but low blue means the tumor should appear as yellow, as shown in the Figure.

| Figure 5. a. kep or Washout, note intense area for tumor, b. DWI High B, note intense area for tumor, c. ADC, note dark area for tumor. d. Color generated by assigning red channel to Washout, green to DWI High B, blue to ADC. e. Histology Slice most closely matches MRI, tumor outlined. f. In-Scene ACE Detection map shown as False color image. |