This Dog Can Hunt !!
Ten sets of prostate tumor volumes from the MRI and Histology images were analyzed. These ten patients were selected because they showed evident washout rates (kep ) within the prostate indicating high vascularization within the tumor. No restrictions were placed regarding tumor placement in the peripheral zone or central gland, nor size (1 cc to 15 cc). Figure shows a plot of the histology volume against the MRI volumes. A linear fit was applied to the

data showing high correlation coefficient (R=0.94, P=0.0005), high fitted slope (0.78) and low intercept (0.5). Tumors can be quite heterogeneous so that a single signature inserted into a supervised target detector such as ACE and SAM may not describe or cover the entire tumor. Multiple signatures may need to be inserted into ACE and SAM to cover the entire tumor. Moreover, it is likely that the “radiologic margin” is less sensitive than the “histologic margin” due to decreases in tumor density in the advancing edge of the tumor.

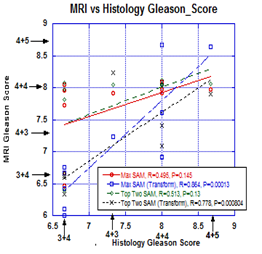
The Gleason scores for the same set of patients were analyzed and compared to the scores determined by the pathologist’s assessment of histology slices. This study examined tumors throughout the prostate and attempted to minimize the bias by not confining the search to the peripheral zone nor to the central gland. Spectral Angle Mapper (SAM) is a supervised target search algorithm. The Gleason score algorithm queried the SAM value and found the maximum Gleason score and also a weighted average of the top two Gleason scorers. Four sets of measurements were recorded for reach voxel inside the tumor: Maximum SAM, Weighted Average SAM using untransformed signatures, and Maximum SAM, and Weighted Average SAM using transformed signatures.
| TABLE I
GLEASON SCORE SENSITIVITY/SPECIFICITY
|
Figure plots the average Gleason score within a tumor using a number of target detection algorithms applied to registered MRI against the pathologist’s assessment. The highest correlation (R=0.86, P=0.00012) and highest slope is generated using the Maximum SAM values that use the transformed signatures as is shown in Figure 10. Conventional Gleason scores are superimposed on both sets of axis in Figure 10.Evidently there are some inter-patient global variability in the image generation that is corrected using the signatures with the Whitening-DeWhitening transform superimposed on both sets of axis in Figure 10.Evidently there are some inter-patient global variability in the image generation that is corrected using the signatures with the whitening-dewhitening transform.
Table summarizes the sensitivity and specificity of the transforms in determining the Gleason Score for the four sets of target searches, namely, Maximum SAM and Weighted Average SAM using untransformed signatures, and Maximum SAM, and Weighted Average SAM using Whitened-DeWhitened transformed signatures. Based on an initial training set of 10 patients we were able to predict the Gleason score on MRI using transformed signatures inserted into supervised target algorithms, yielding a sensitivity of 80 % and specificity of 77.5 to 80 % for predicting Gleason scores. Other methods have generated similar overall results but this method produces results on a per voxel basis making it more useful for directing biopsies. Supervised target detection achieved high correlation scores, ranging from 0.78 to 0.94, between the predicted and actual Gleason scores.
